

Ada banyak cara untuk membuat sebuah portfolio menjadi sangat tinggi hasilnya, dengan berbagai strategi. Utamanya, kalau digabungkan dengan Price Index 6m sebagai 2nd filter.
Price Index 6m
Price Index 6m = Current share price / Share price 6 months ago. It’s a ratio that shows the return of a share price over a past period. Dividends are included (added) to the price index calculation.
What the values mean
A value greater than one shows that there’s been a price increase, whereas a value of less than one shows that there has been a price decrease.
Magic Formula With 2nd Factors
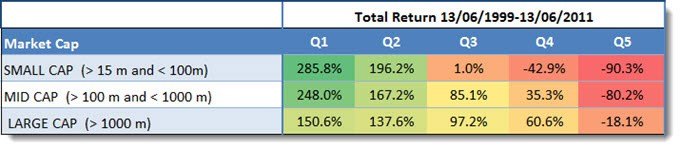
This article shows you the back tested returns of the Magic Formula investment strategy in Europe over the 12 year period from June 1999 to June 2011. You can also see how you can improve the Magic Formula returns from 183% to 783% by just adding one simple easy to calculate ratio.
Each year all the portfolios were formed on 16 June. We chose 16 June as most European companies have a December year-end and by this date all their previous year-end results would be available.
The best ranked 20% of Magic Formula companies were put in the first quintile (Q1), the next in the second, and so on, with the 20% of companies with the worse Magic Formula ranking in the fifth quintile (Q5).
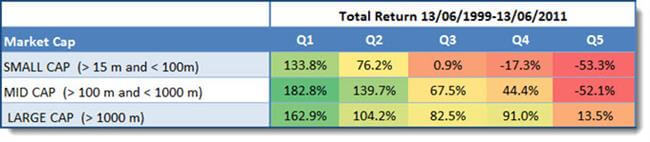
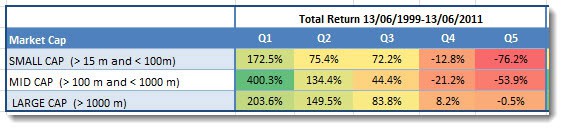
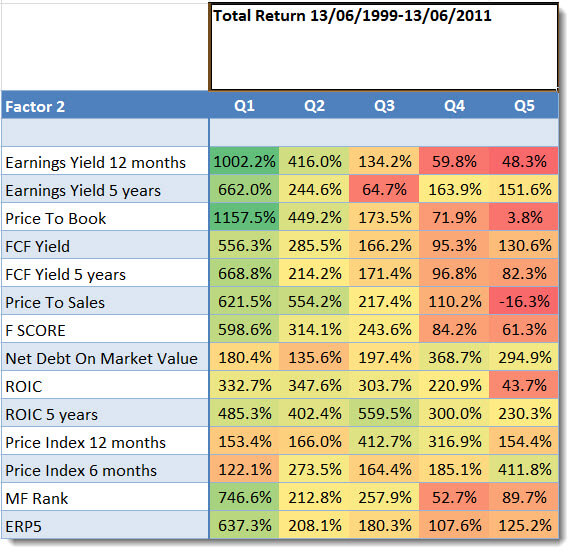
We also tested the Magic Formula investing strategy with a lot of other ratios and, as you can see in the table below, the returns of the strategy can be improved substantially.
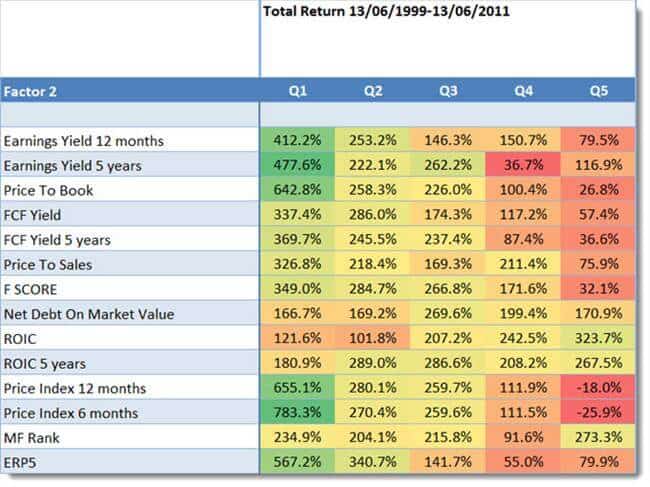
Best combination +783% was Momentum. This means you could have earned the highest return of 783.3% over 12 years if you invested in the best ranked Magic Formula companies that also had the highest 6 month price index (price momentum).
How the companies were selected
Here are the exact details of the back tested investment strategy:
- Countries – 17 Eurozone countries (Austria, Belgium, Cyprus, Estonia, Finland, France, Germany, Greece, Ireland, Italy, Luxembourg, Malta, the Netherlands, Portugal, Slovakia, Slovenia, and Spain)
- Exclude banks, insurance companies, investment funds, certain holdings companies, and REITS
- Exclude companies with an average 30-day trading volume of less than €10,000
- Portfolios formed on the first trading day of the year (Because the back test database is point in time there is not risk of look-ahead bias)
- Returns were compounded on an annual basis
- Select the 20% best ranked Magic Formula companies
- Sort the list by Price Index 6 months from high to low
- Buy the top 50 companies by Price Index 6 months on an equal weight basis
- Rebalance after one year
https://www.quant-investing.com/strategies/magic-formula-investing-and-momentum
Earnings Yield With 2nd Factors
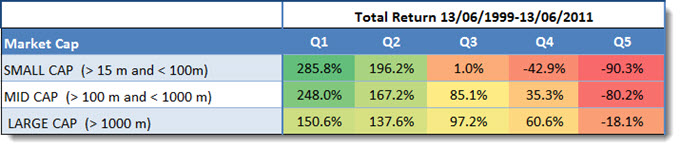
Earnings Yield (Earnings before Interest and Taxes (EBIT) / Enterprise Value) is one of the best, if not the best valuation ratio you can use. Numerous research reports have compared it to other ratios, over most time periods, and it will nearly always give you the best return.
Each year all the portfolios were formed on 16 June. We chose 16 June as most European companies have a December year-end and by this date all their previous year-end results would be available in the database.
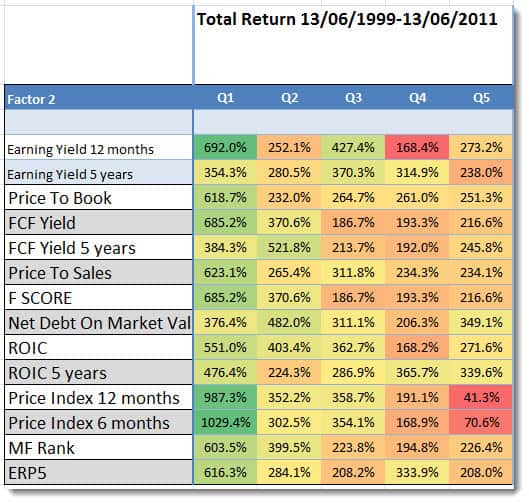
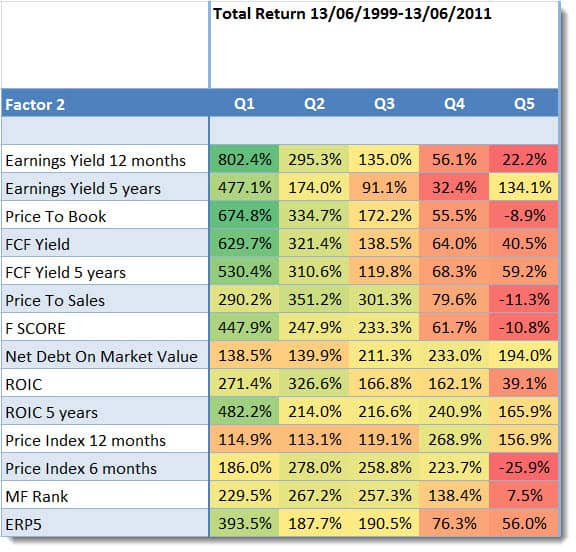
You can improve your returns substantially if you combine an Earnings Yield investment strategy with another ratio or indicator as the table below clearly shows. In the test below we first selected the 20% of companies with the highest Earnings Yield, then split this group of companies into Q1 to Q5 based on the indicator or ratio in the Factor 2 column.
How to implement this – value momentum – strategy in your portfolio
This is how you can implement this strategy in your portfolio using the screener:
- As the first factor select the 20% of companies with highest earnings yield (EBIT/Enterprise value)
- As a second factor select the 20% of companies with the highest Price Index 6m (six months price momentum)
- Select the countries where you would like to invest
- Set your minimum trading value per day – $125,000 in the image below
- Select the minimum market value of companies you would like to look for – $65m in the image below
- Click on the filter button to run your screen
https://www.quant-investing.com/strategies/earnings-yield-and-momentum-investment-strategy
ERP5 With 2nd Factors
And that is exactly what I found when I read the research paper by Philip Vanstraceele and Luc Allaeys, both good friends, called Studying different Systematic Value Investing Strategies on the Eurozone stock market.
In the research paper Luc and Philip set out to design and test an investment strategy that combined the following valuation and quality ratios:
- Earning Yield (EBIT / Enterprise Value) – Pre-tax earnings compared to the enterprise value or purchase price of the company
- Return on Invested Capital (EBIT / (Net Working Capital + Net Fixed Assets)) – The return a company generates ion the capital invested in the business.
- Price to Book (Market value / Book value) – share price compared to the book value of the company
- Trailing 5-year average Return on Invested Capital.
They named the strategy ERP5, based on the first letters of the 4 factors. To get the ERP5 rank all companies are ranked on each of the four factors. These rankings are then added together to give the combined ERP5 rank of the company.
The lower the ERP5 ranking of a company is the more attractive it is as an investment idea. In other words the lower the better.
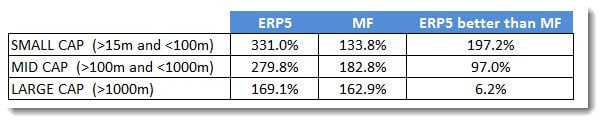
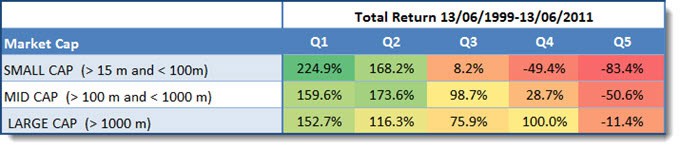
As you can see the ERP5 strategy, for all size companies, did substantially better than the Magic Formula investing strategy, in fact for small companies if you would have had done nearly 200% better.
But ERP5 returns can be improved
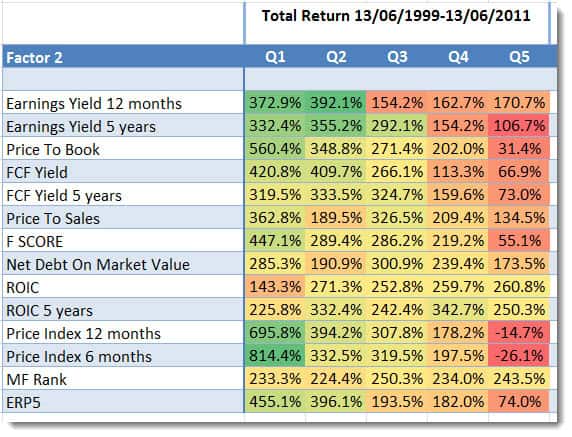
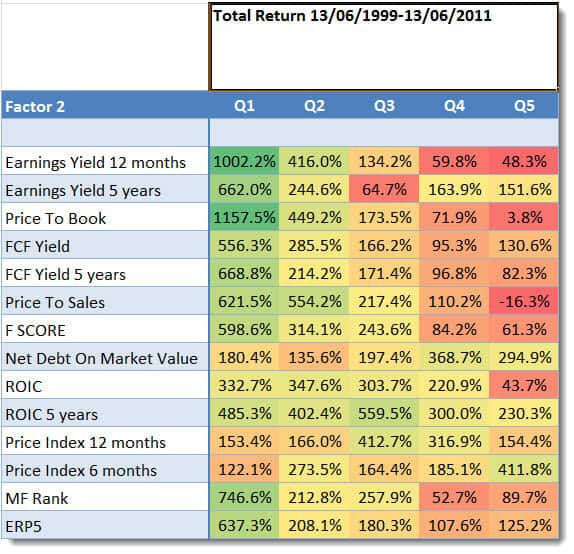
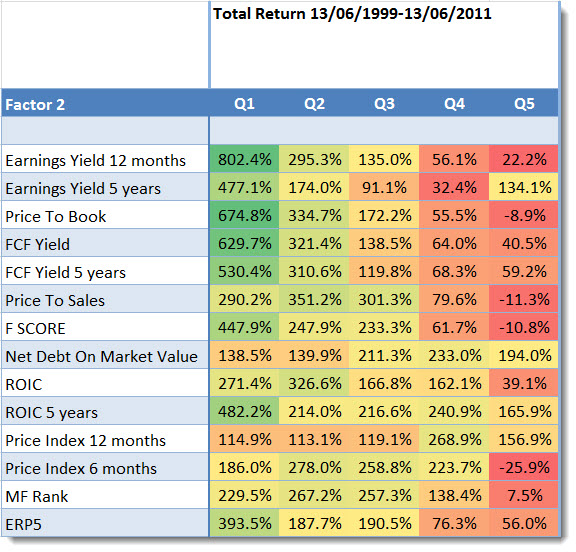
In the above mentioned back-test we also tested the ERP5 strategy with a lot of other factors and as you can see in the table below the returns of the strategy can be substantially improved.
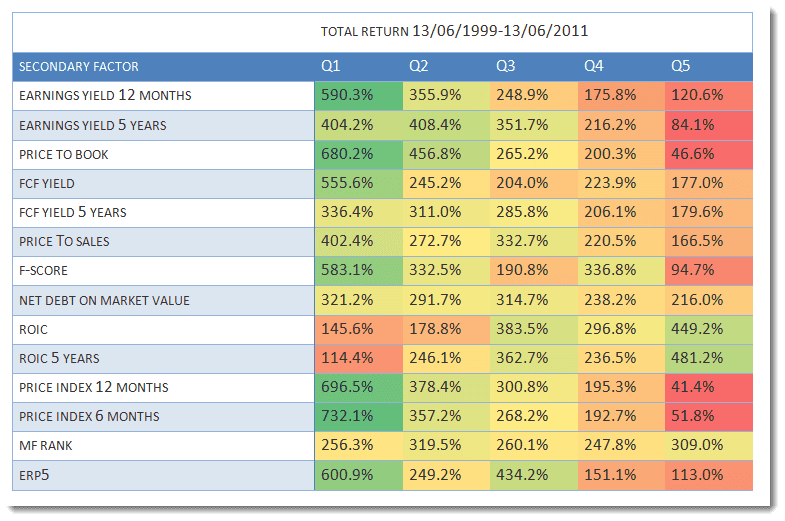
The returns you should look at are those in column Q1. They show the returns generated by first selecting the 20% best ERP5 companies and then sorting them by the ratios in the Secondary Factor column.
https://www.quant-investing.com/blog/a-better-alternative-to-the-magic-formula
Price to Book With 2nd Factors
The Price to Book ratio (Current share price / Book value per share) is a good valuation ratio you can use to find undervalued investment ideas.
Each year all the portfolios we tested were formed (and re-balanced) on 16 June. We chose 16 June as most European companies have a December year-end and by this date all their previous year-end results would be available in the database.
Q1 (Quintile 1) represents the cheapest 20% of companies in terms of PB and Q5 (quintile 5) the most expensive. The lowest PB companies (Q1) substantially outperformed the market, which over the same 12 year period returned 30.54%.
But you can do a lot better. As mentioned you can improve your returns substantially if you combine Price to Book with another ratio or indicator as the table below clearly shows:
https://www.quant-investing.com/strategies/price-to-book-and-6m-momentum-investment-strategy
Reversed: Price Return 6m With 2nd Factors
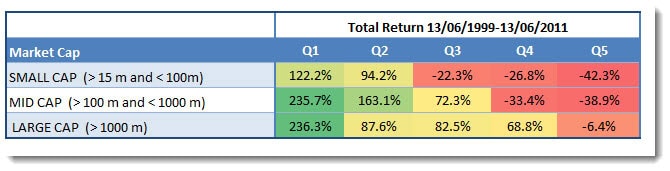
Q1 (Quintile 1) represents the 20% of companies with the highest Price Index (share price has gone up the most) and Q5 (Quintile 5) companies with the lowest Price Index (share price has gone up the least or fallen the most).
https://www.quant-investing.com/strategies/momentum-and-price-to-book-investment-strategy
Other Strategies
https://www.quant-investing.com/strategies
Important PDFs
Value Composite One (VC1)
Same idea with InvestingPro FairValue (17 Metrics!)
James O’Shaughnessy tested and proved this in What Works on Wall Street. The Value Composite One (VC1) is a way of ranking companies by valuation developed by James O’Shaughnessy and explained in the latest edition of his excellent book What Works on Wall Street: The Classic Guide to the Best-Performing Investment Strategies of All Time
James O’Shaughnessy tested and proved this in What Works on Wall Street.
He found that companies selected based on a number of valuation measurements outperformed companies undervalued on any single valuation ratio 82% of the time.
If you think about it this makes a lot of sense.
If you only use the price to book ratio to find ideas you may find a lot of great investments after a big market correction but a lot of bad quality businesses when the markets are not cheap.
Also if you only use the price to book ratio you will completely ignore companies that are cheap based on free cash flow, price to earnings or earnings yield (EBIT/EV).
The answer – a combination of ratios
The answer to this problem is to use one valuation indicator that combines a number of valuation ratios that let you find undervalued companies from different points of view. For example book value, cash flow, net profit and operating profit.
Already done for you
Luckily James already developed a combination of valuation ratios for us and tested it to make sure it can give you market beating returns.
He tested this valuation ranking for all 10-year rolling periods over the 45 year period between 1964 and 2009 and found that it outperformed companies undervalued on any single valuation ratio 82% of the time.
It’s called Value Composite One
James called his collection of valuation ratios Value Composite One (VC1) and it is calculated using the following five valuation ratios:
- Price to book value
- Price to sales
- Earnings before interest, taxes, depreciation and amortization (EBITDA) to Enterprise value (EV)
- Price to cash flow
- Price to earnings
How is the value Composite One ranking calculated?
Just how is the VC1 ranking of a company calculated you may be thinking?
It is really quite easy.
You have to rank each company against all other companies based on every one of the five valuation ratios and then calculate a combined ranking for the company.
In the Quant Investing stock screener we make it easy for you to understand as we give each company a percentile ranking (1 to 100) for each of the five valuation ratios.
To get the combined VC1 rank these five values are added together and the VC1 ranking of the companies are then grouped by percentile ranking with the 1% best ranked companies getting a value of 1 the next 1% of companies a value of 2 and so on.
For example if a company has a price to sales ratio that is in the lowest one percent for all the companies in the database, it gets a price to sales rank of 1 (lower is more undervalued) and if a company has a PE ratio in the highest one percent (it is overvalued) of all the companies in the database it will get a PE rank of 100.
If a value is missing, because a company made losses and no price earnings ratio is available we give it a neutral value of 50 for that ratio.
Once all the companies have been ranked on all valuation ratios you add up all the values (of the 5 valuation ratios) for each company and rank all the companies in percentiles (from 1 to 100) on this one combined ranking.
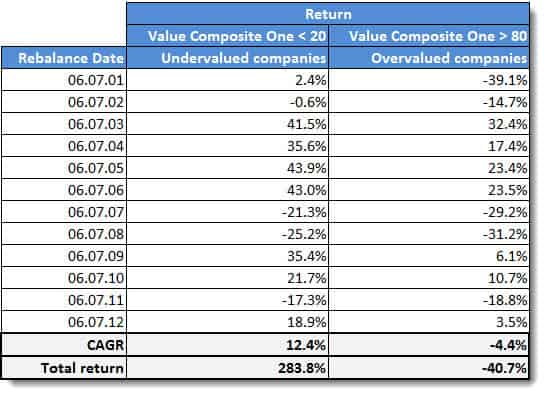
Undervalued = 1 and overvalued = 100
In the screener this means companies that are the most undervalued have aVC1 rank of 1 those with the worst score (most expensive or overvalued company) get a rank of 100.
Does it give you higher returns? – 46 year back test
What did James find when he tested Value Composite One?
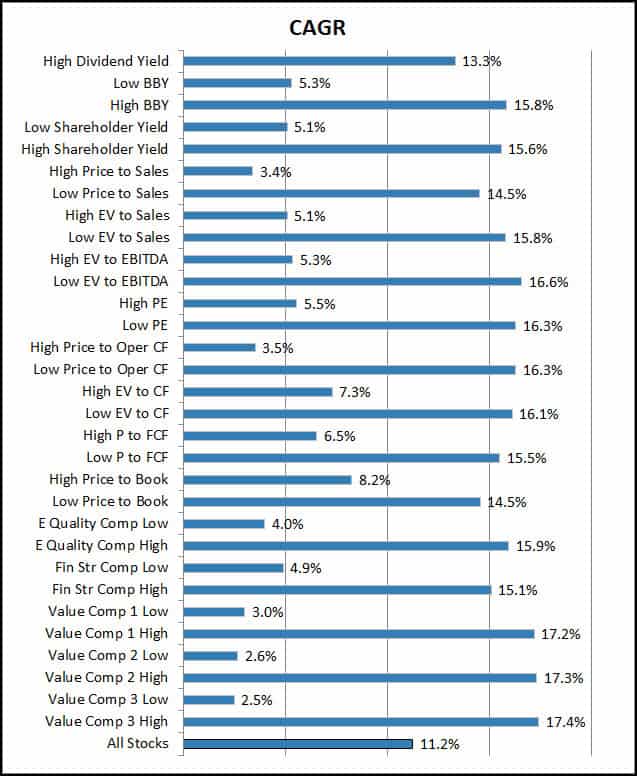
In the blogpost The Value of Value Factors James showed the results of a 46 year back test from 1963 to 2009 where he compared the returns of composite ratios to single valuation ratios.
It worked very well as you can see from the following two charts:
Value Composite Two
Value Composite Two is calculated using the following six valuation ratios:
- Price to book value
- Price to sales
- Earnings before interest, taxes, depreciation and amortization (EBITDA) to Enterprise value (EV)
- Price to cash flow
- Price to earnings
- Shareholder Yield (Dividend yield + Percentage of Shares Repurchased)
In the screener the Value Composite Two has a value of between 0 (undervalued company) and 100 (expensive or overvalued company).
Difference between Value Composite One and Two
The difference between Value Composite One and Two is that Value composite Two has one extra ratio – Shareholder Yield (Dividend yield + Percentage of Shares Repurchased).
Companies are thus ranked by one additional indicator – how much money they have returned to shareholders.
https://www.quant-investing.com/news/value-composite-two-added-to-the-screener
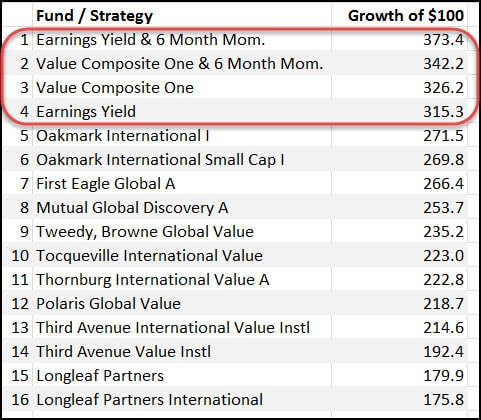
Value Composite With 6m Price Returns
If you invested $100 in each of the funds and and the quantitative value strategies this is the amount you would have had at the end of the 10 years.
https://www.quant-investing.com/blog/a-simple-ration-beats-the-world-s-best-value-funds
2005: Value Composite One-Two-Three
James O’Shaughnessy introduced his Value Composites in different editions of his seminal book, What Works on Wall Street. While the specific numerical naming (1, 2, 3) is often used in subsequent research and online strategy tools, their formal introduction occurred as follows:
- Value Composite 1 (VC1): Featured in the 3rd Edition, published on May 24, 2005. This composite originally combined five key ratios: Price-to-Book, Price-to-Earnings, Price-to-Sales, Price-to-Cash Flow, and Enterprise Value-to-EBITDA.
- Value Composite 2 (VC2): Formally introduced in the 4th Edition, released in November 2011. VC2 is often considered the more robust version as it adds a sixth factor—Shareholder Yield (Dividend Yield + Share Buyback Yield)—to the original five ratios.
- Value Composite 3 (VC3): This variation appeared alongside VC1 and VC2 in the 4th Edition (2011) research. It is a more concentrated version of the composite used to identify the absolute cheapest decile of stocks.
For reference, the original book was first published in 1996 (or 1997 for some prints), but these specific multi-factor composites were not part of that first edition.
2023: Qi Value
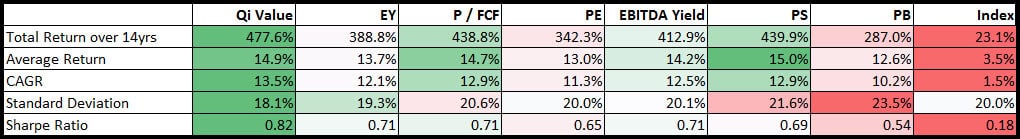
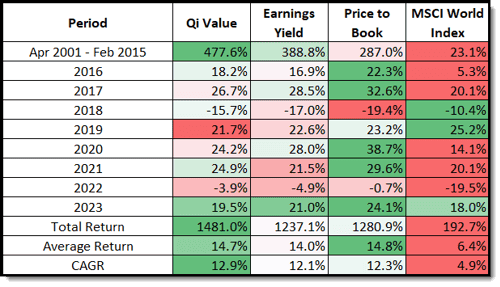
We tested the Qi Value against the following six ratios:
- Earnings Yield (EY) = Earnings Before Earnings and Taxes / Enterprise Value
- Price to Free Cash Flow (P/FCF)
- Price to Earnings (PE)
- Earnings before interest, taxes, depreciation and amortisation / Enterprise value (EBITDA Yield)
- Price to Sales (PS)
- Price to Book (BP)
Qi Value is a Lot Better
As you can see Qi Value performed better than all the other ratios, except the average return of the Price to Sales ratio was higher.
Apart from that the Qi Value had a:
- The highest total return +477.6%
- The highest compound annual growth rate (CAGR) over the 14 year period
- The lowest standard deviation which means Qi Value returns were not as volatile as the other ratios
- The highest Sharpe ratio (higher is better) which means it would have given you higher risk adjusted returns. Here is the Sharpe ratio definition.
Q.i. Value is calculated with the following ratios:
- EBITDA Yield (EBITDA / EV)
- Earnings Yield (EBIT / EV)
- FCF Yield (FCF / EV)
- Liquidity (Q.i.) (Operating profit / Yearly traded value)
The lower the Qi Value the more undervalued the company
The Qi Value ranking ranges from 1 to 100 and this is how it is calculated:
- We first rank all the companies in the database by each of the ratios from good to bad – from 1 to 22,000.
- We then add the four rankings of each company together and rank the whole universe by this combined ranking.
- Once all the companies are ranked we divide then into groups that make up 1% of the total universe – for example the best 1% of companies by the combined ranking get a Qi Value ranking of 1, the next 1% a ranking of 2, until 100.
- We do this to give all companies a Qi Value ranking from 1 to 100. 1 = the best ranking (most undervalued) and 100 the worse.
Ratios
Once you have selected undervalued companies with Qi Value you can also add your favourite ratios or indicators – here are a few suggestions:
Momentum
Combine Qi Value with the following indicators to find companies with an upward moving share price – this is a good way to avoid value trap companies. The following are all good indicators to use:
- Price Index 6 months
- Price Index 12 months – 1 month
- Price Index 12 months
- Adjusted Slope 125/250d
- Adjusted Slope 90d
https://www.quant-investing.com/blog/qi-value-investment-strategy-back-test
https://www.quant-investing.com/glossary/qi-value
Why use a composite factor?
As industry sectors go in and out of favour, so do stocks ranked by individual value ratios. This means that a single valuation ratio can underperform for extended periods of time and research has not found a way time these cycles.
Back testing by O’Shaughnessy Asset Management found a composite valuation ratio like Quant Value Composite never dropped below the top three single valuation ratio in any five-year period over the 26-year period from 1987 to 2013.
Not only that it was also one of only two valuation ratios that outperformed the market in every period. All other single valuation ratio at some point dropped to the bottom three. A composite valuation ratio outperformed the individual ratios in 87% of all rolling five-year periods.
https://www.quant-investing.com/news/quant-value-composite-introduction
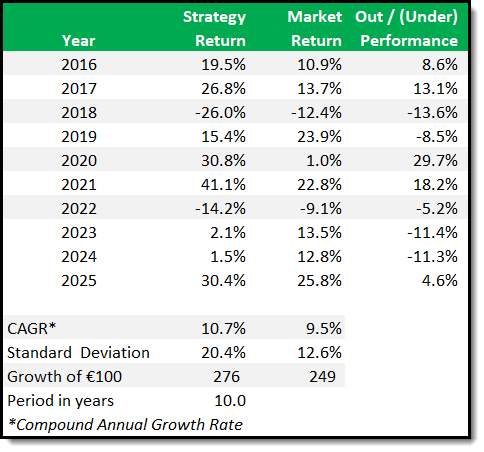
2025: Magic Formula with 6m Price Momentum
This is the summary results of a back test of the Magic Formula combined with momentum (Price Index 6 months) investment strategy in Europe over the nine year period from January 2016 to December 2025.
https://www.quant-investing.com/blog/magic-formula-investment-strategy-back-test